
Engeman® Visualization
Visual management and reliability for maintenance.

Engeman® Visualization
Visual management and reliability for maintenance.
Engeman® Visualization Module
With Engeman® Visualization Module, your company uses several maintenance indicators, with an easy view through Dashboard.
The Visualization module allows the manager a holistic view of the maintenance process through visual management. It is compatible with television, mobile devices and totems.
See Engeman® Visualization advantages
- Visual management;
- Assertiveness in decision-making;
- Dashboards;
- Unlimited simultâneos accesses.

Maintenance smart management is with Engeman® Visualization
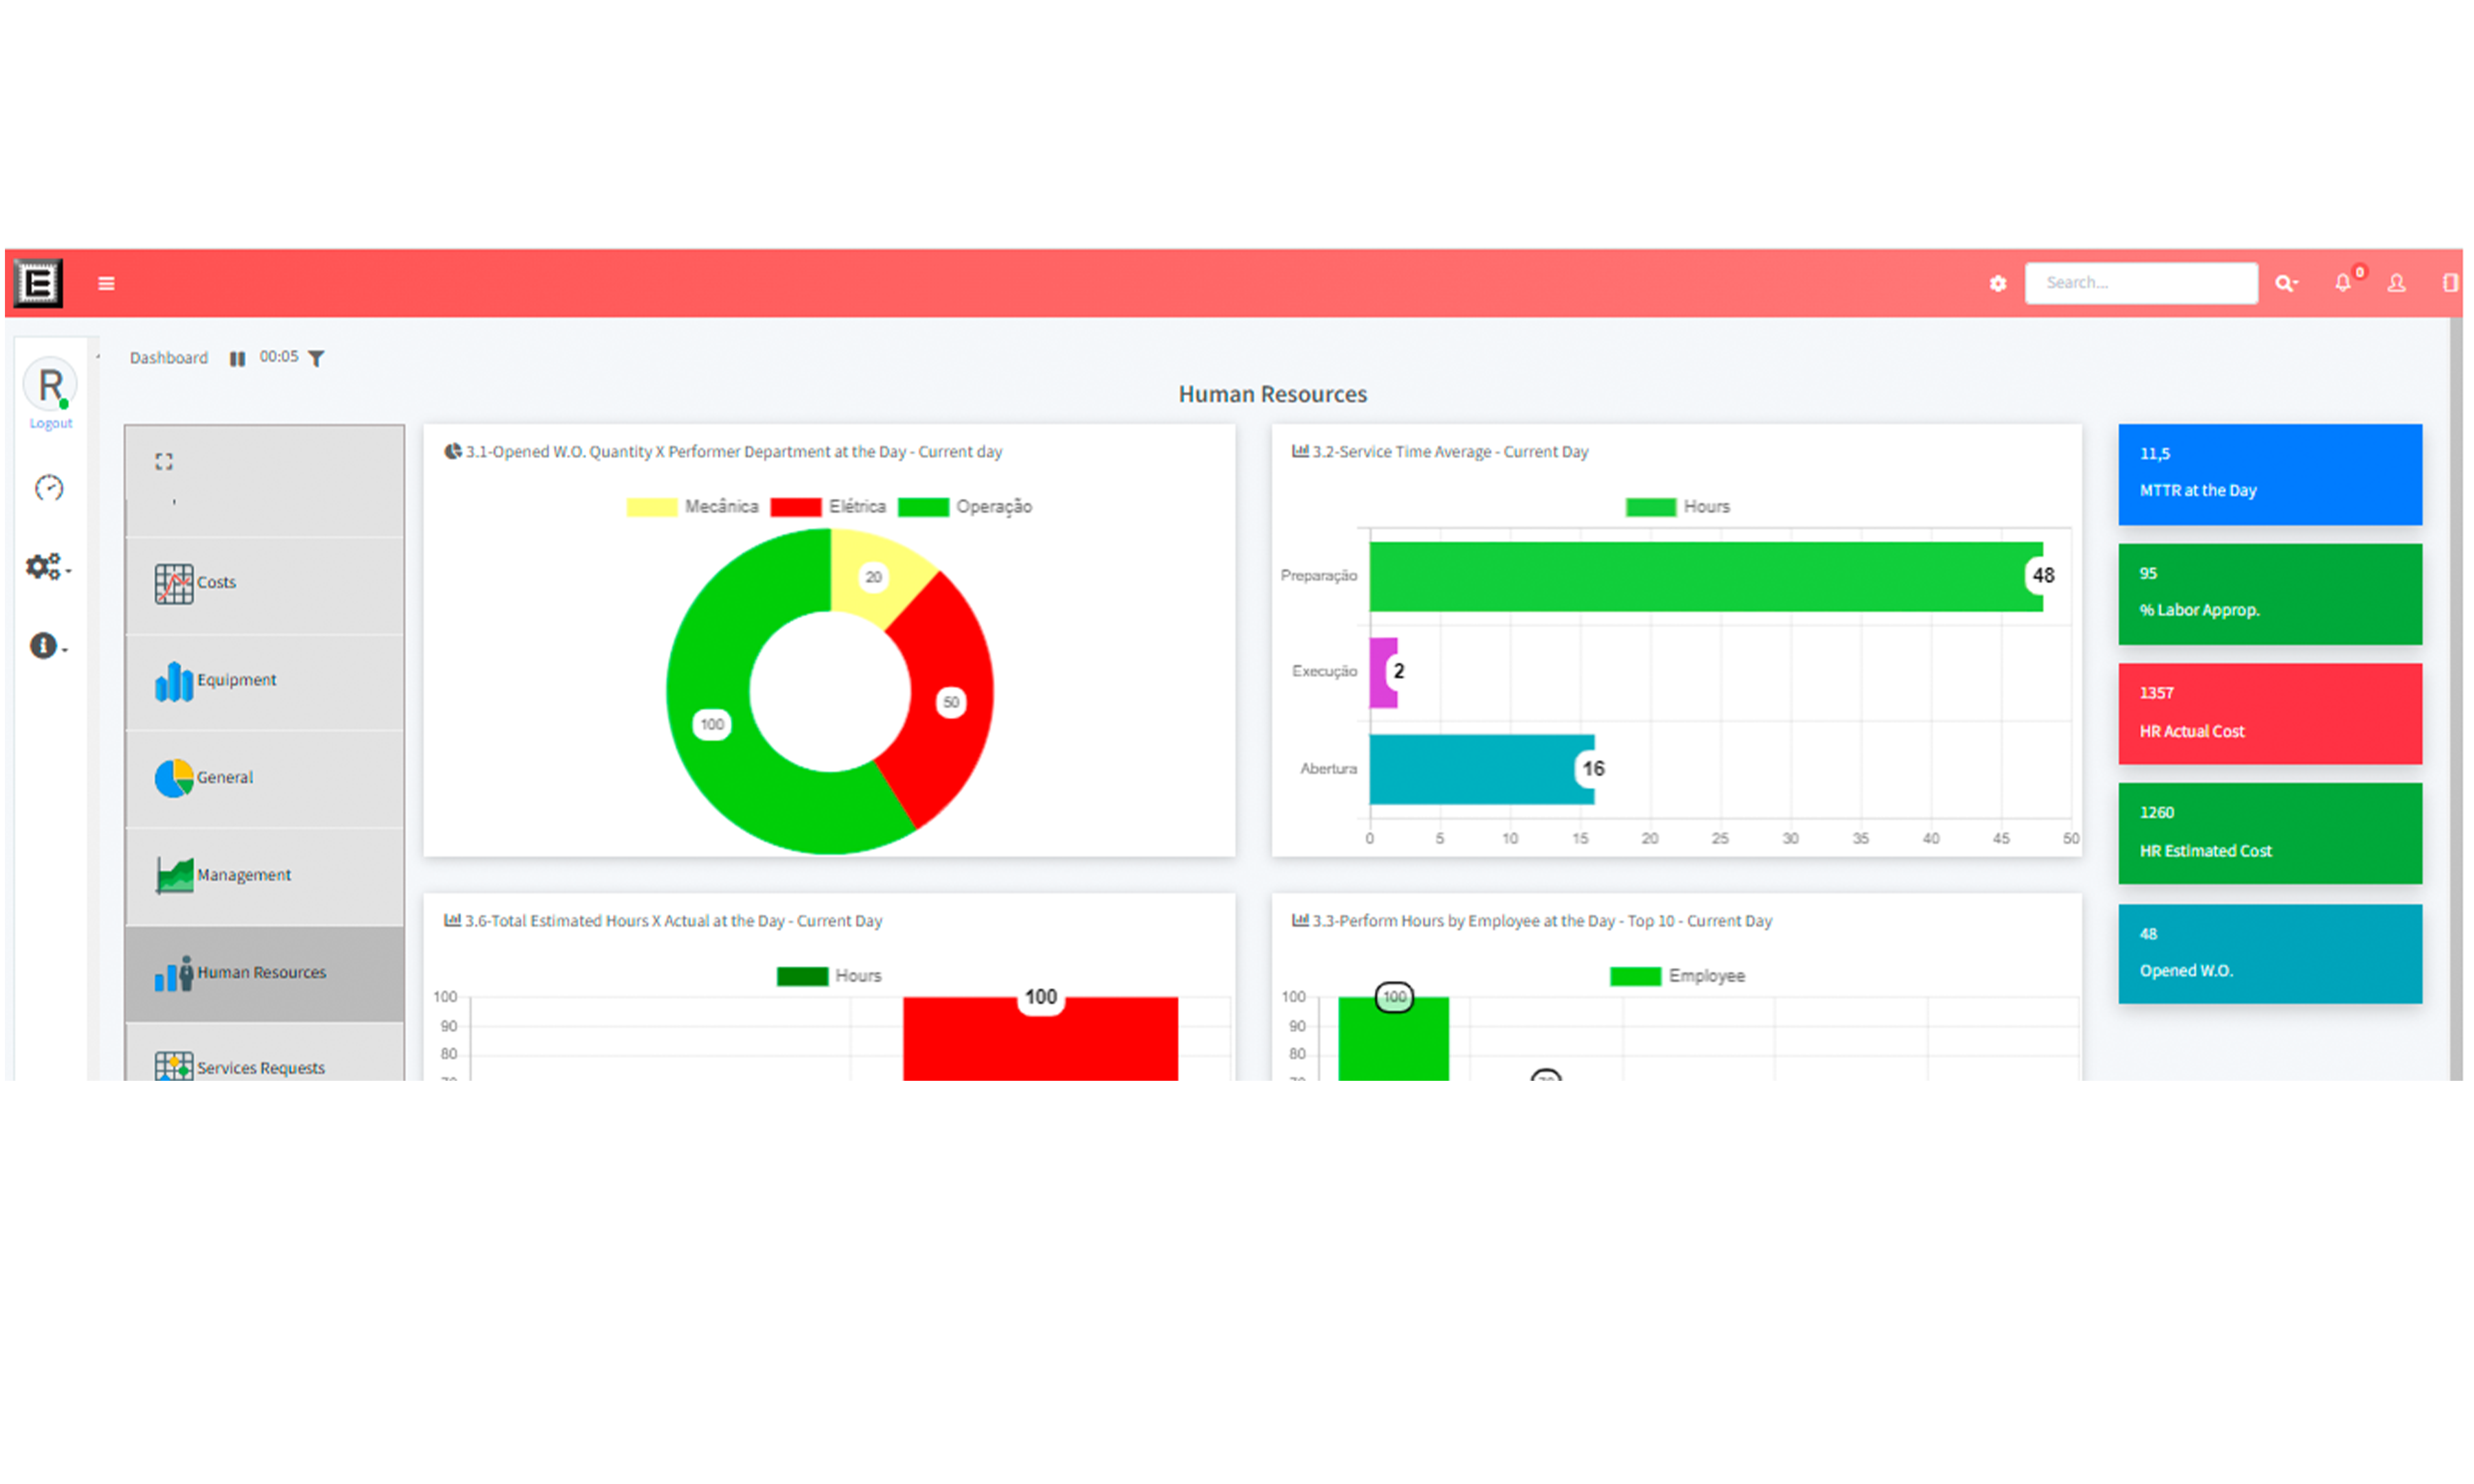
MAINTENANCE VISUAL MANAGEMENT
- Monitor reports in real time;
- Monitor your SLA;
- Make Synoptic Monitoring of your assets and monitor interactive map;
- Manage backlog;
- Monitor MTBF and MTTR of each asset;
- Make your projection according to your equipment reliability.
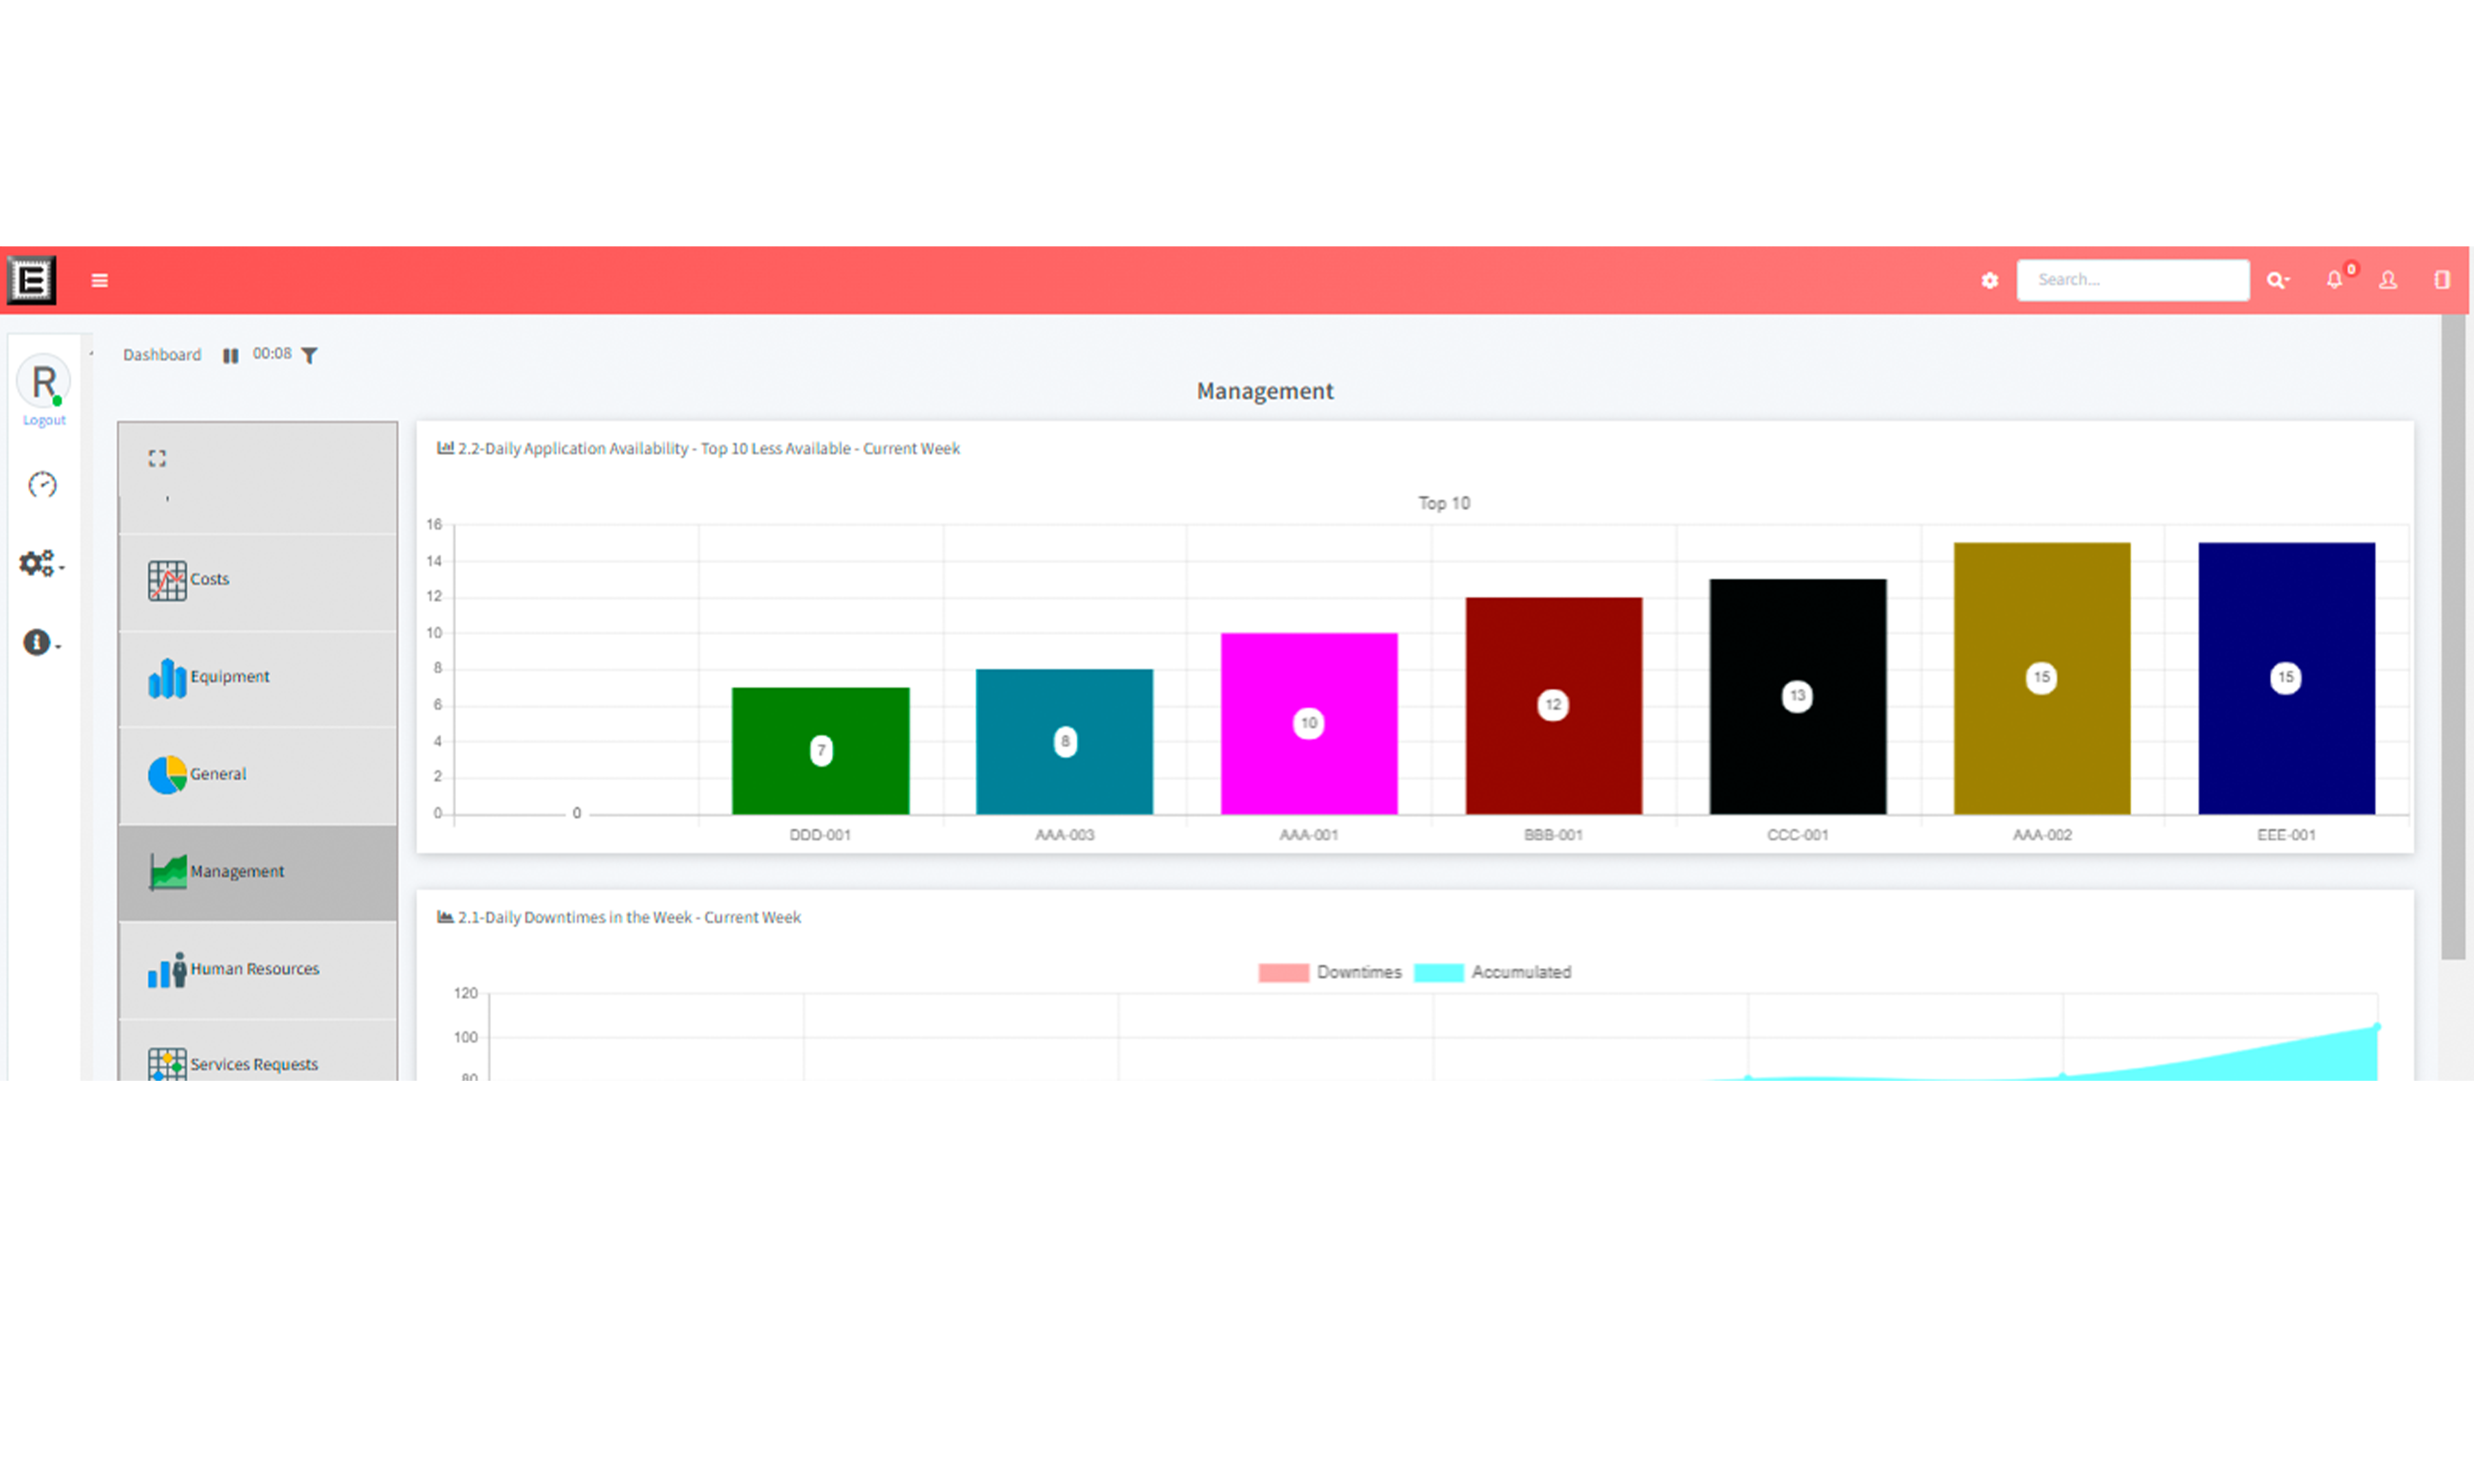
OPTIMIZE YOUR MANAGEMENT PROCESSES AND ACHIEVE HIGH PERFORMANCE
- Monitor the cumulative chart of daily equipment downtime;
- Make failures analysis of unscheduled downtime;
- Monitor the interference in the productive process;
- Find continuous improvement opportunities in your maintenance.
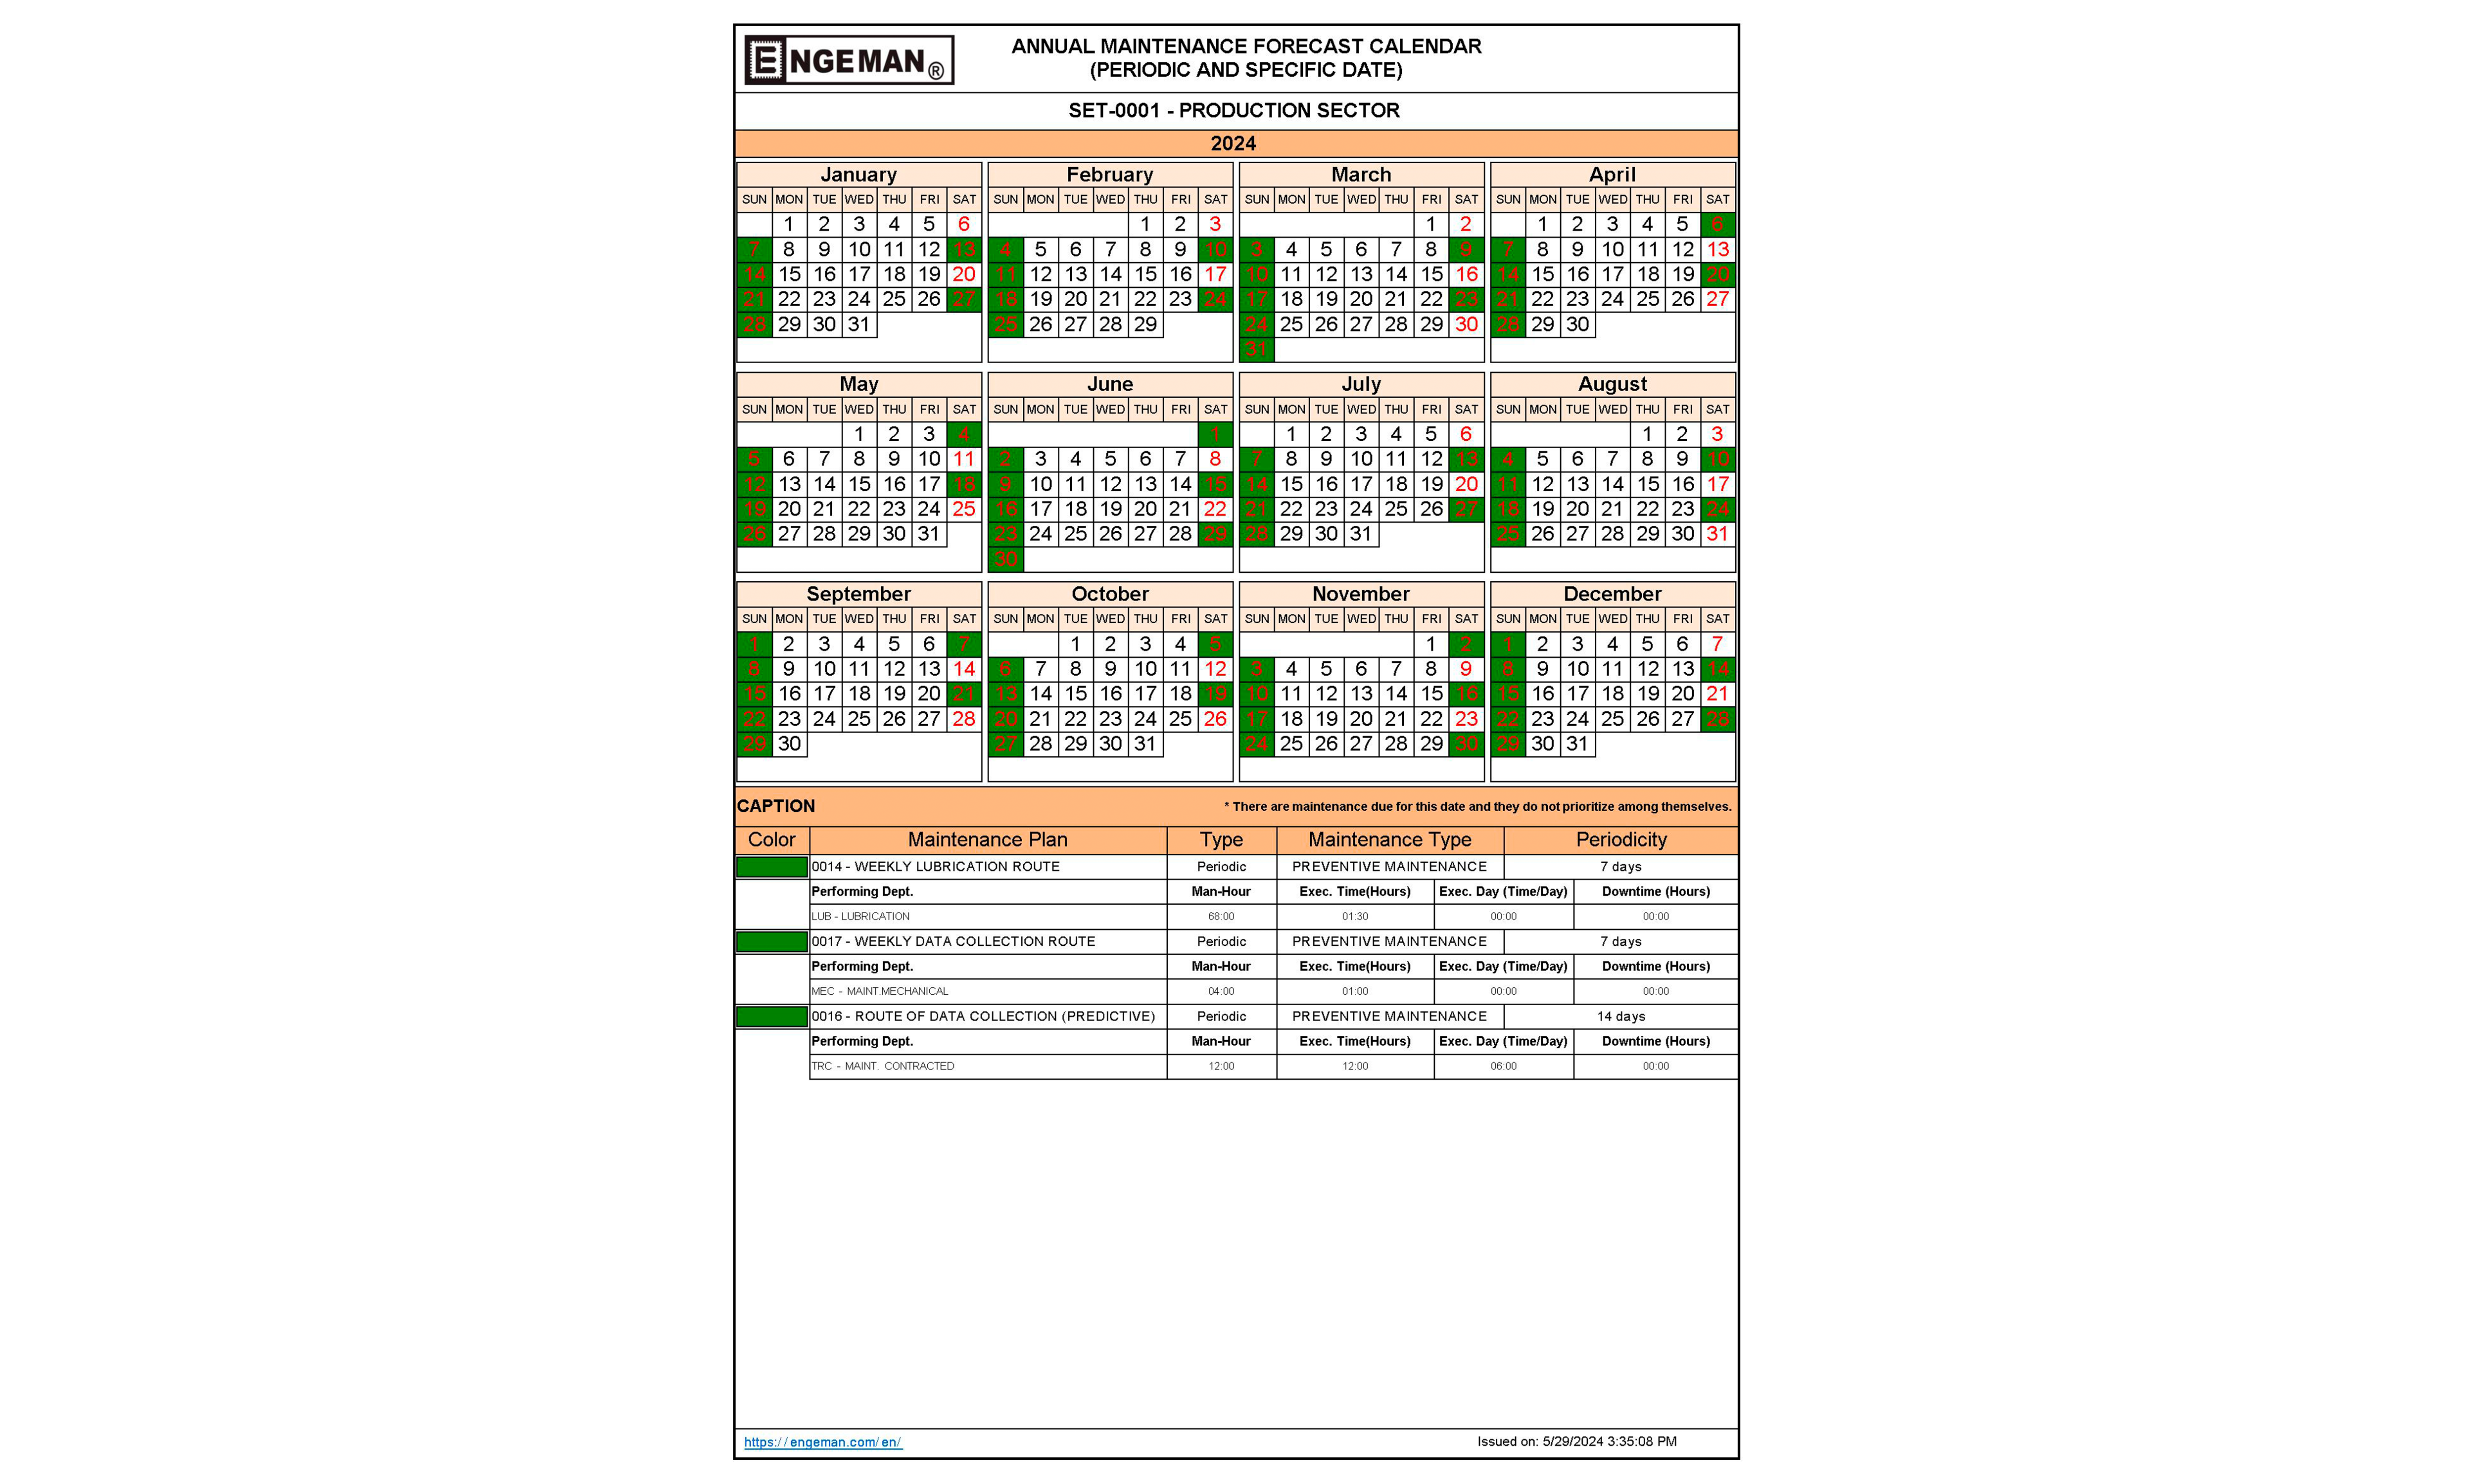
ASSERTIVE AND INTELLIGENT PLANNING
- Make your planning according with your labor and resources availability;
- Consult the daily expected schedule of your maintenance;
- Monitor the 52 calendar weeks;
- Verify expected reports and labor appropriation, and plan management reports;
- Have increasingly assertive planning, without rescheduling or cancellations.
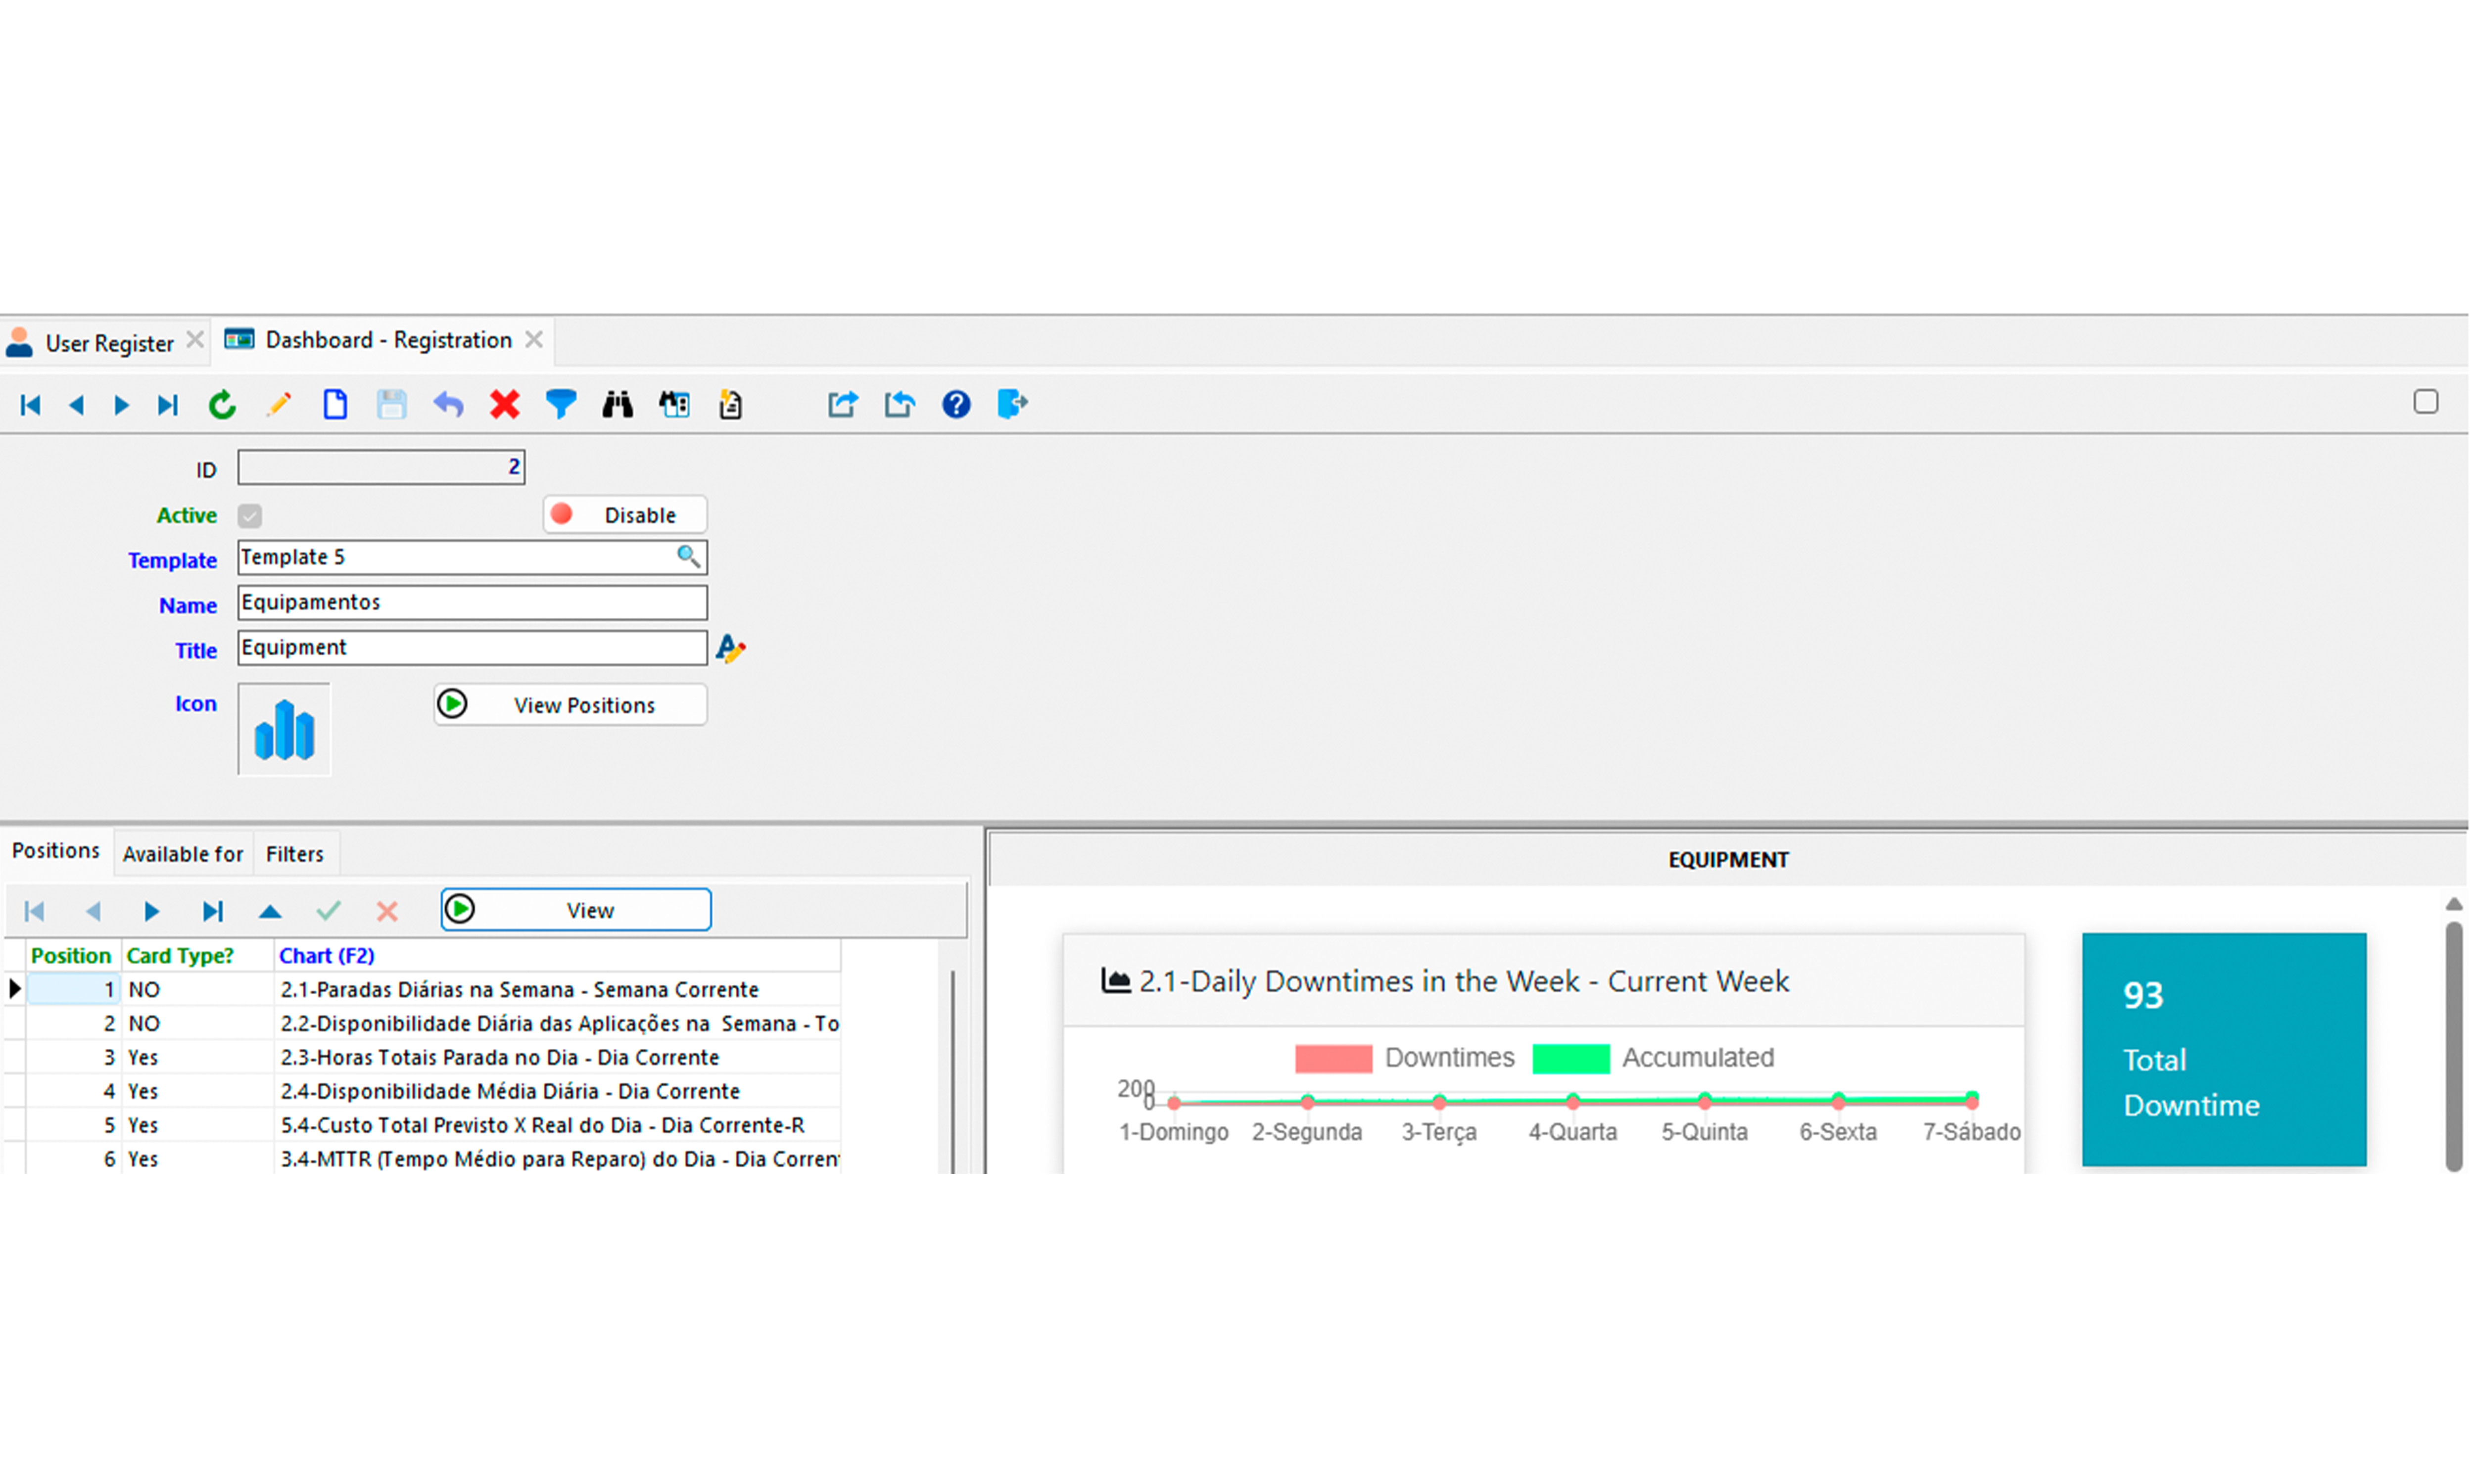
MORE FLEXIBILITY IN YOUR ANALYSIS
- Create custom charts through the Dashboard tool;
- View information quickly and dynamically;
- Customize templates and charts, thus making the tool more flexible according to the rules of your business.
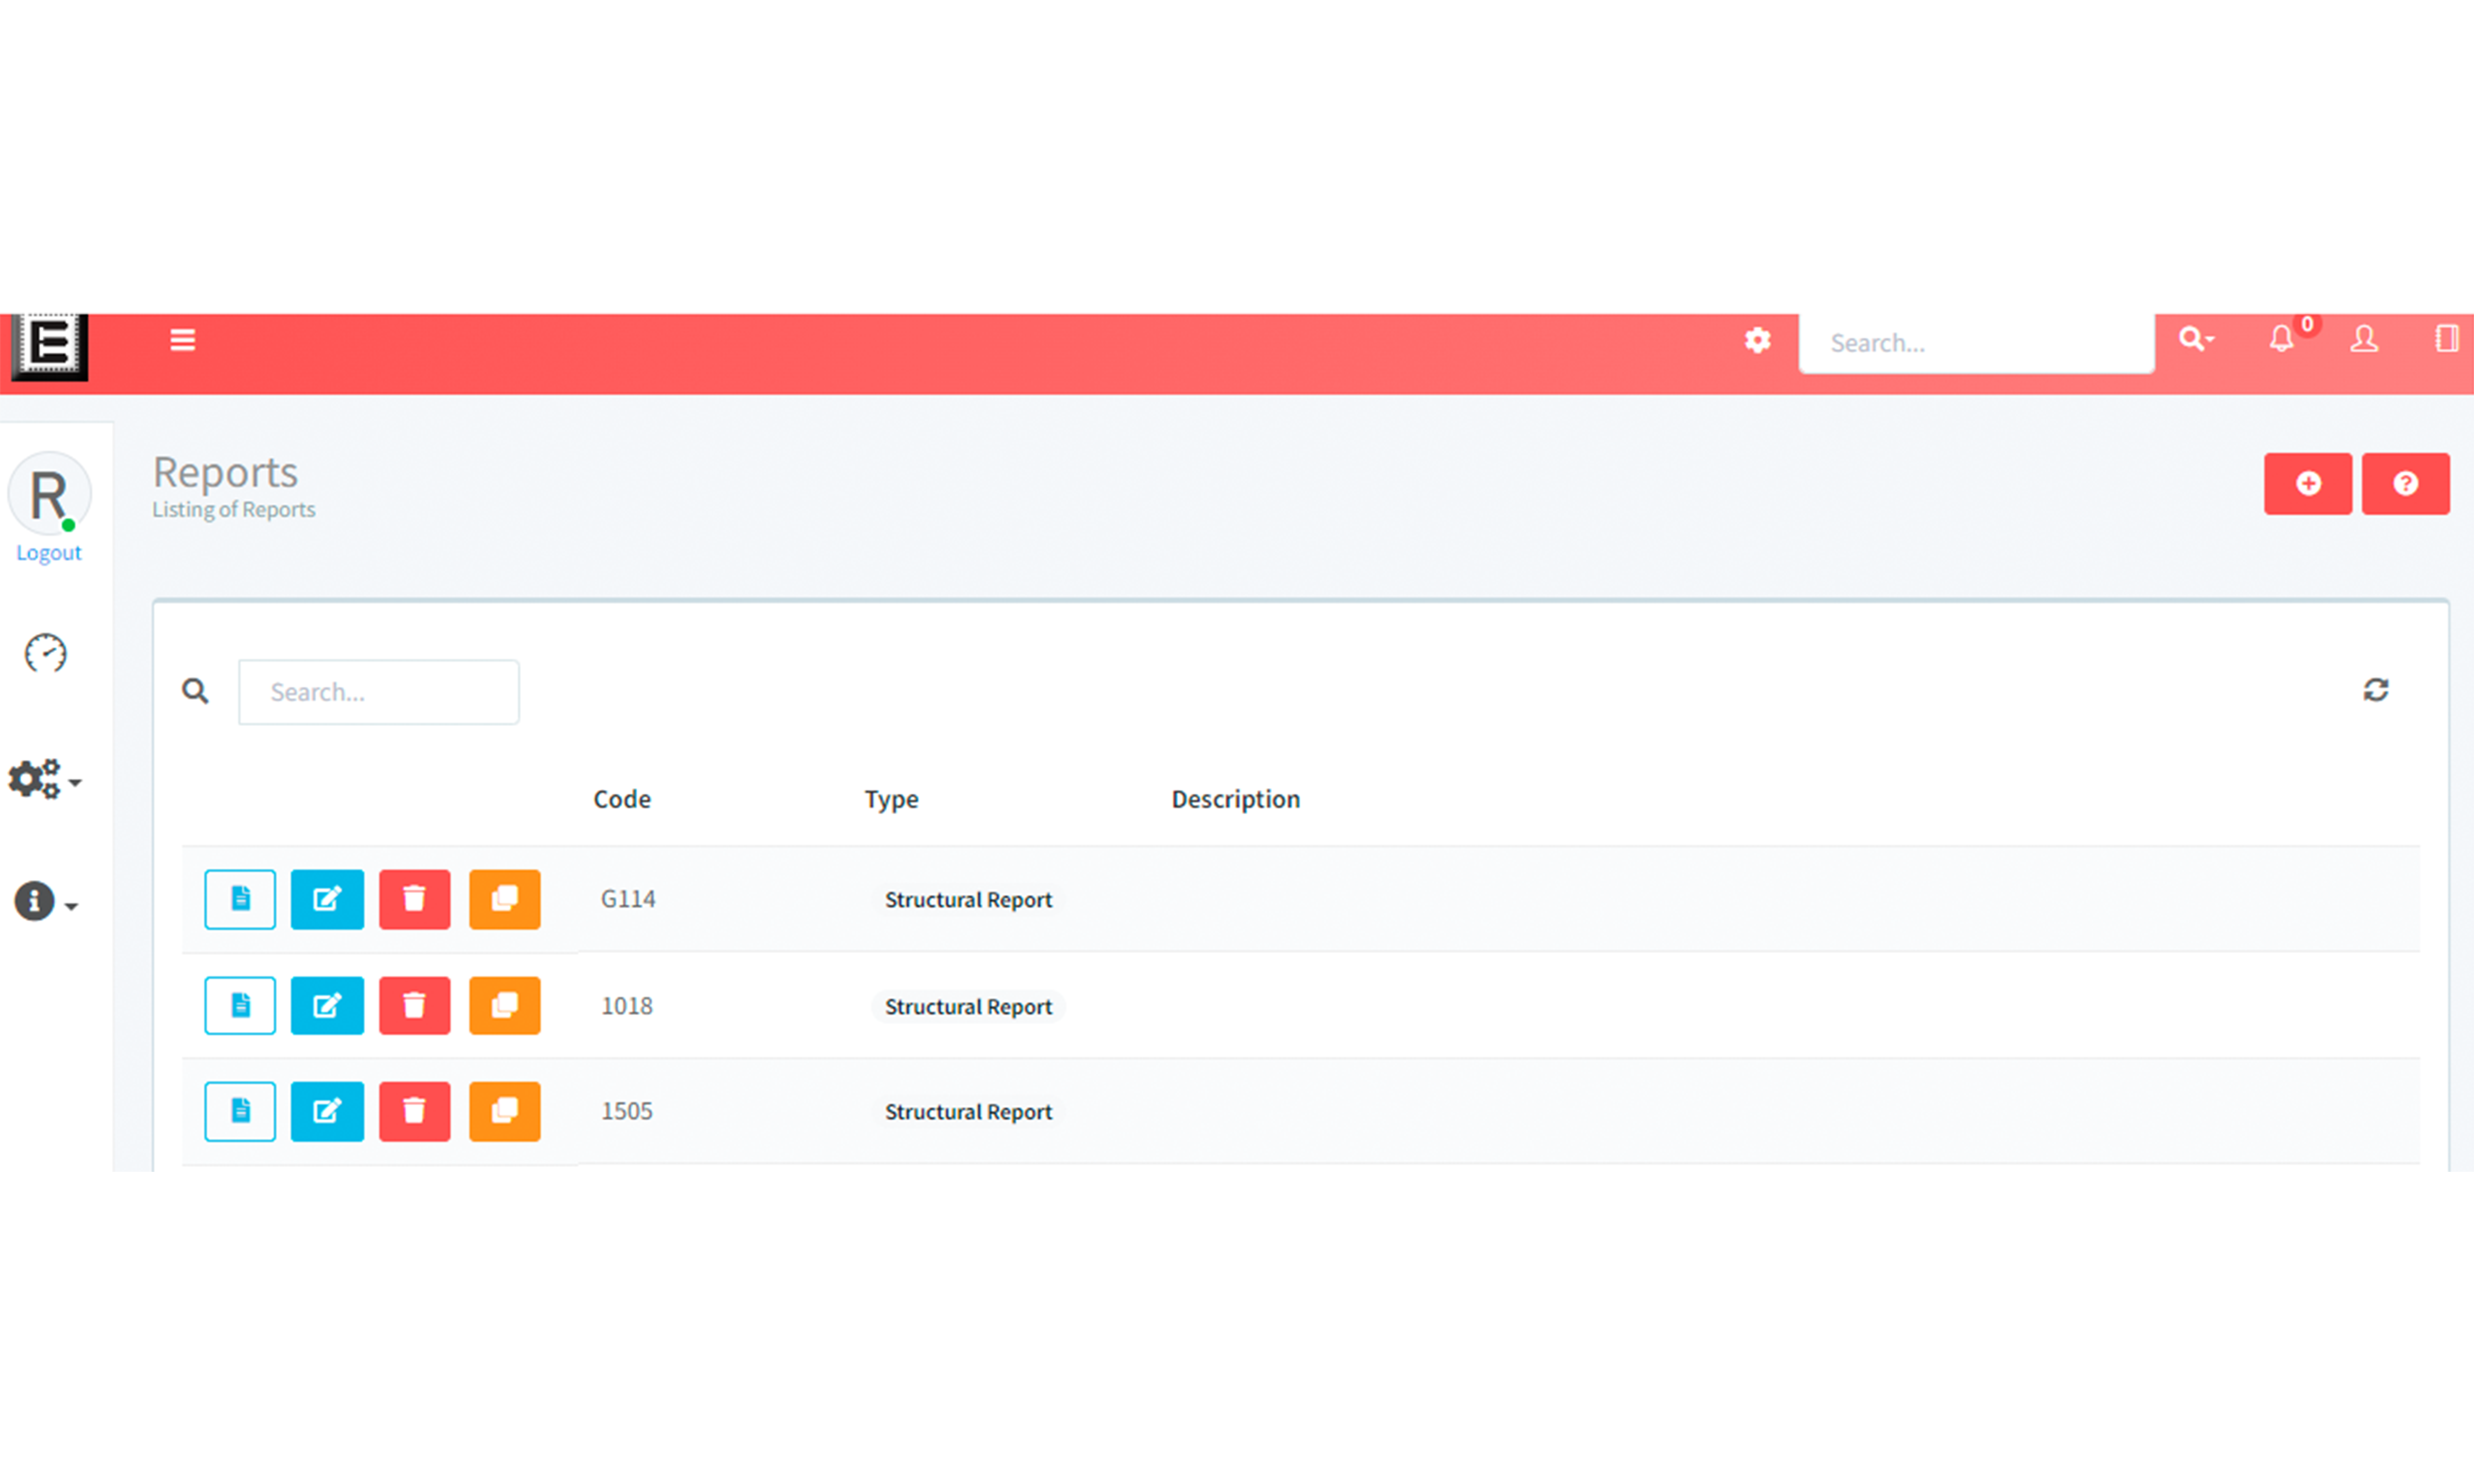
CONSULT WHENEVER YOU NEED TO
With more than 290 report templates, standard dashboards, and the flexibility to customize your own, access complete maintenance cost information, comparative charts, dynamic reports, and more from any device.
Dashboards are the visual interfaces used to show indicators, metrics, and other measurable information.
Engeman® in a few words
Visual Management in your maintenance is with Engeman® Visualization
What our customers say...
Gelprime
"From the beginning, Engeman® brought advantages because it effectively integrated the departments within Gelprime. We also noticed that the amount of corrective maintenance in some departments decreased, as we started to have more agility in predictive and preventive maintenance arising from the maintenance plans deployed in Engeman®."
Arena das Dunas
“We have all the preventive measures registered and the control is easy. If I want to take a report for the next year of everything that is going to be executed and on what date, I already have it here in the software. Everything that was done backwards as well, I have a record of all the maintenance that was performed, the material requisitions that were used to perform that maintenance. With all this, I can assemble several indicators from this history.”
Learn more Engeman® modules and versions
Sign up for our newsletter
and receive free content for your maintenance!
Have more dynamism in maintenance with dashboards and visual management!


Have more dynamism in maintenance with dashboards and visual management!